The Visplot tutorial
Introduction
Visplot is a visibility plot and observation scheduling tool designed for ground-based astronomical observatories. It helps observers visualize target visibility, apply observational constraints (both science-driven like airmass limits and time windows, and hardware-specific like telescope configuration and instrument limitations), and build a nightly observing plan with minimal manual bookkeeping. Because let’s face it, staying awake, aware, and fully functional during the whole observing night is tough enough without juggling all these details manually.
For a high-level overview of Visplot’s capabilities, see About Visplot. The main interface is web-based and requires no installation for end users. For detailed information about the web interface features and limitations, see Web interface for visplot. A local deployment is available for development, testing, or offline use; see Custom installation of Visplot for installation instructions.
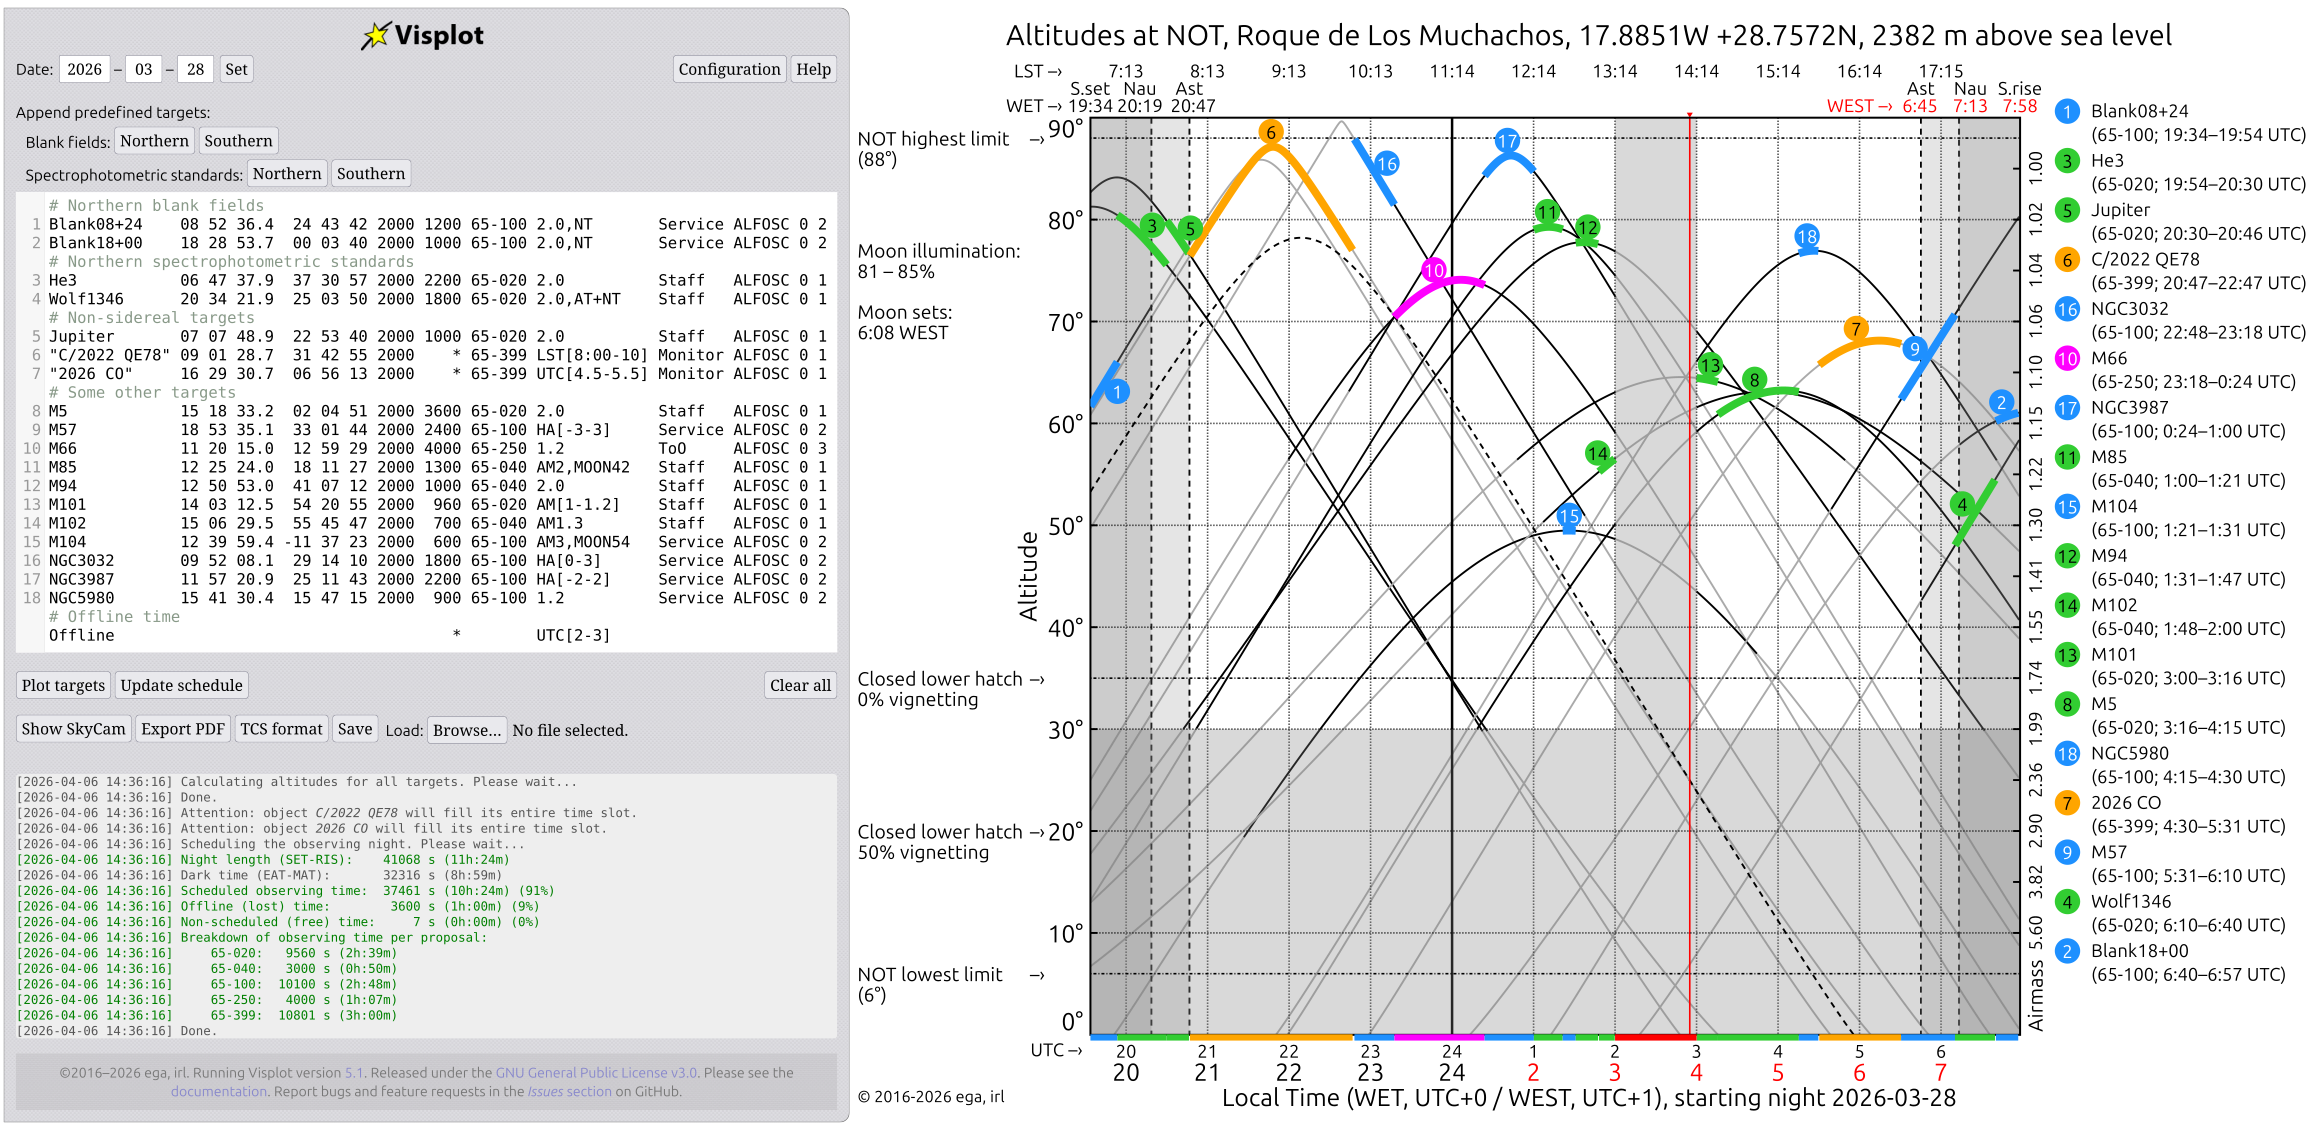
Fig. 1 Example of a full-night schedule produced by Visplot for a heterogeneous set of targets.
Quick start
Open the Visplot page in a modern web browser.
Set the observing date using the Date fields and press Set.
Enter your targets in the target list or append predefined targets.
Press Plot targets to draw the visibility curves.
Press Schedule observations to generate a feasible schedule.
Use the Show SkyCam button (if available), the target details panel, or export tools as needed.
How the interface works
The Visplot interface has two main areas, as you can see in Fig. 2:
Sidebar (A): Contains the main controls for date selection (A1), configuration (A2), help (A2), predefined target buttons (A3), target input (A4), plotting (A5), scheduling (A5), export (A6), save/load (A6), and the running log (A7).
Main canvas (B): Displays the visibility plot (B1), telescope selection (B2), altitude constraints and Moon illumination (B4) and, after scheduling, highlights the allocated observing windows for each target.
The sidebar also provides:
a Configuration (A2) button for default values and scheduler options
a Help (A2) button with the built-in user guide
Clear all (A5) to reset the target list and state
Export PDF (A6) to save the current plot
TCS format (A6) to generate a TCS catalog compatible with NOT
Save and the Load file selector (A6) to preserve and restore session state
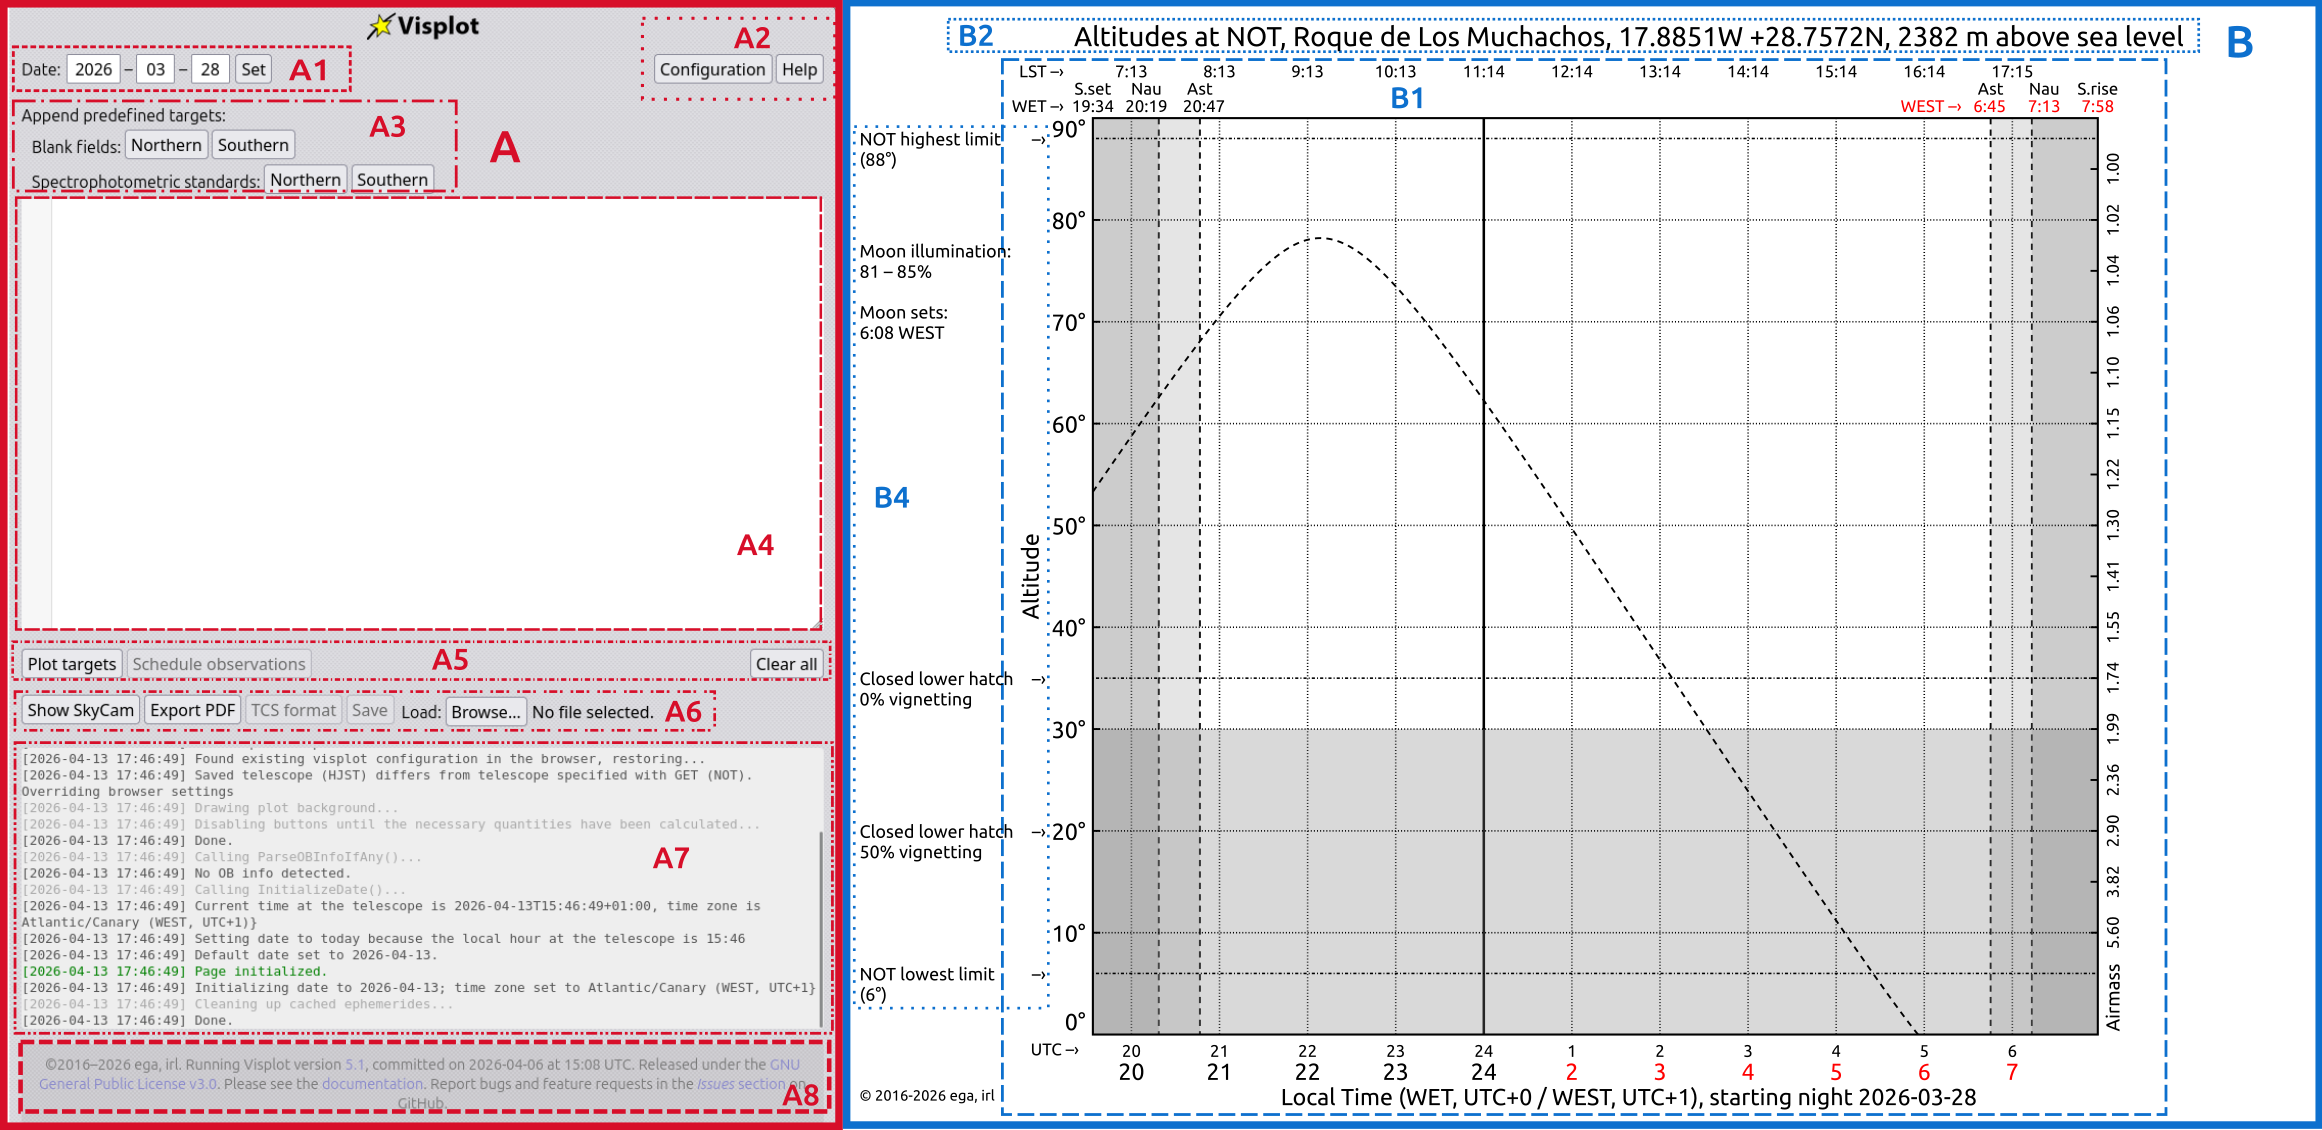
Fig. 2 Visplot landing page.
Basic workflow
Set the observing date
Enter the night you want to plan in the three date fields and press Set. Visplot will load the ephemerides for that night. By default, the page is preloaded for today’s observing night after noon, or for last night before noon.

Fig. 3 Date zoom-in.
Enter or append targets
Type targets in the text area using the Visplot input syntax described in Target input syntax.
You can also append predefined targets with the buttons under Append predefined targets:
Northern / Southern blank fields
Northern / Southern spectrophotometric standards
These buttons append the selected predefined targets to the existing list.
Target input syntax
Targets are entered one per line, using the following general format:
[NAME] [RA]/[pmRA] [DEC]/[pmDEC] [EPOCH] [OBSTIME] [PROJECT] [CONSTRAINTS] [TYPE] [OBINFO] [SKYPA] [PRIORITY]
The mandatory fields on the list are the target coordinates [RA] and [DEC], the rest of the fields may be omitted from the right-hand side; missing values are filled with defaults from the configuration panel.
In the case that the object is included in Simbad, only the [NAME] is mandatory, the coordinates will then be retrieve from the database. (Pro tip: SIMBAD is like that knowledgeable friend who always knows where everything is—except when it doesn’t, and then you’re back to manual entry.)
Field definitions
[NAME]: Object name. Spaces are allowed if the name is quoted, e.g."Object 5".[RA]: Right ascension in either space-separated or colon-separated format, e.g.23 34 34.7or23:34:34.7.[pmRA]: Optional proper motion in RA (arcsec/year); if omitted, it is assumed to be0.0.[DEC]: Declination, same format as RA.[pmDEC]: Optional proper motion in Dec (arcsec/year); omitted means0.0.[EPOCH]: Coordinate epoch, either1950or2000.[OBSTIME]: Total exposure time in seconds, including overheads. Use*for a target that must remain scheduled for the full specified interval.[PROJECT]: Project or proposal identifier.[CONSTRAINTS]: Visibility constraints such as airmass, moon distance, hour angle, UTC, LST, and twilight restrictions.[TYPE]: Observation type, one ofMonitor,ToO,SoftToO,Payback,Fast-Track,Service,CATService,Visitor, orStaff. ForStafftargets, you can add initials likeStaff/IRL.[OBINFO]: Optional observing block metadata or instrument name.defaultis used when no value is provided.[SKYPA]: Sky position angle in degrees for the finding chart orientation.[PRIORITY]: Scheduling priority; higher values are scheduled earlier when constraints are otherwise similar.
Common constraint examples
Airmass:
2.0,AM1.5,AM[1.2-1.4]Moon distance:
MOON40,MOON[40-180]Hour angle:
HA[0-3],HA[-2-2]UTC range:
UTC[20:00-23:30]LST range:
LST[2-4:30]Twilight / dark time mode:
NT,AT,DARK, or combinations likeAT+DARKOffline periods:
Offline UTC[20:30-22:30]orOffline LST[23-3.5]
When multiple constraints are needed, separate them with commas, for example:
HA[0-5],AM[1.2-1.5],MOON165
Notes
The fields
[EPOCH],[OBSTIME],[PROJECT],[CONSTRAINTS],[TYPE],[OBINFO],[SKYPA], and[PRIORITY]are optional.[NAME]and[PROJECT]may contain spaces if quoted.Blank lines are ignored.
Lines beginning with
#are treated as comments and are not plotted or scheduled.
(And remember: Visplot is forgiving, but not psychic. If your target isn’t showing up, double-check that syntax—it’s usually the culprit, not a cosmic conspiracy.)
Examples
Basic target:
EQPsc 23 34 34 -01 19 36
SIMBAD identifier only:
Aldebaran
Fully specified target:
EQPsc 23 34 34.70 -01 19 36.01 2000 2600 54-321 2.0 Monitor default 0 1
With proper motion:
HD84937 09 46 12.06/0.373 13 59 17.44/-0.774 1950 414 54-501 1.5 ToO
Time-constrained observation:
EQPsc 23 34 34.70 -01 19 36.01 2000 1800 54-321 UTC[22:00-24:00] Staff
Interval scheduling:
EQPsc 23:34:34.70 -01:19:36.01 2000 * 54-321 UTC[20:00-20:30] Staff default
Plot targets
Click Plot targets to parse the current target list and display the visibility curves on the canvas. If the target list is valid, each object is shown as a line representing altitude versus time.
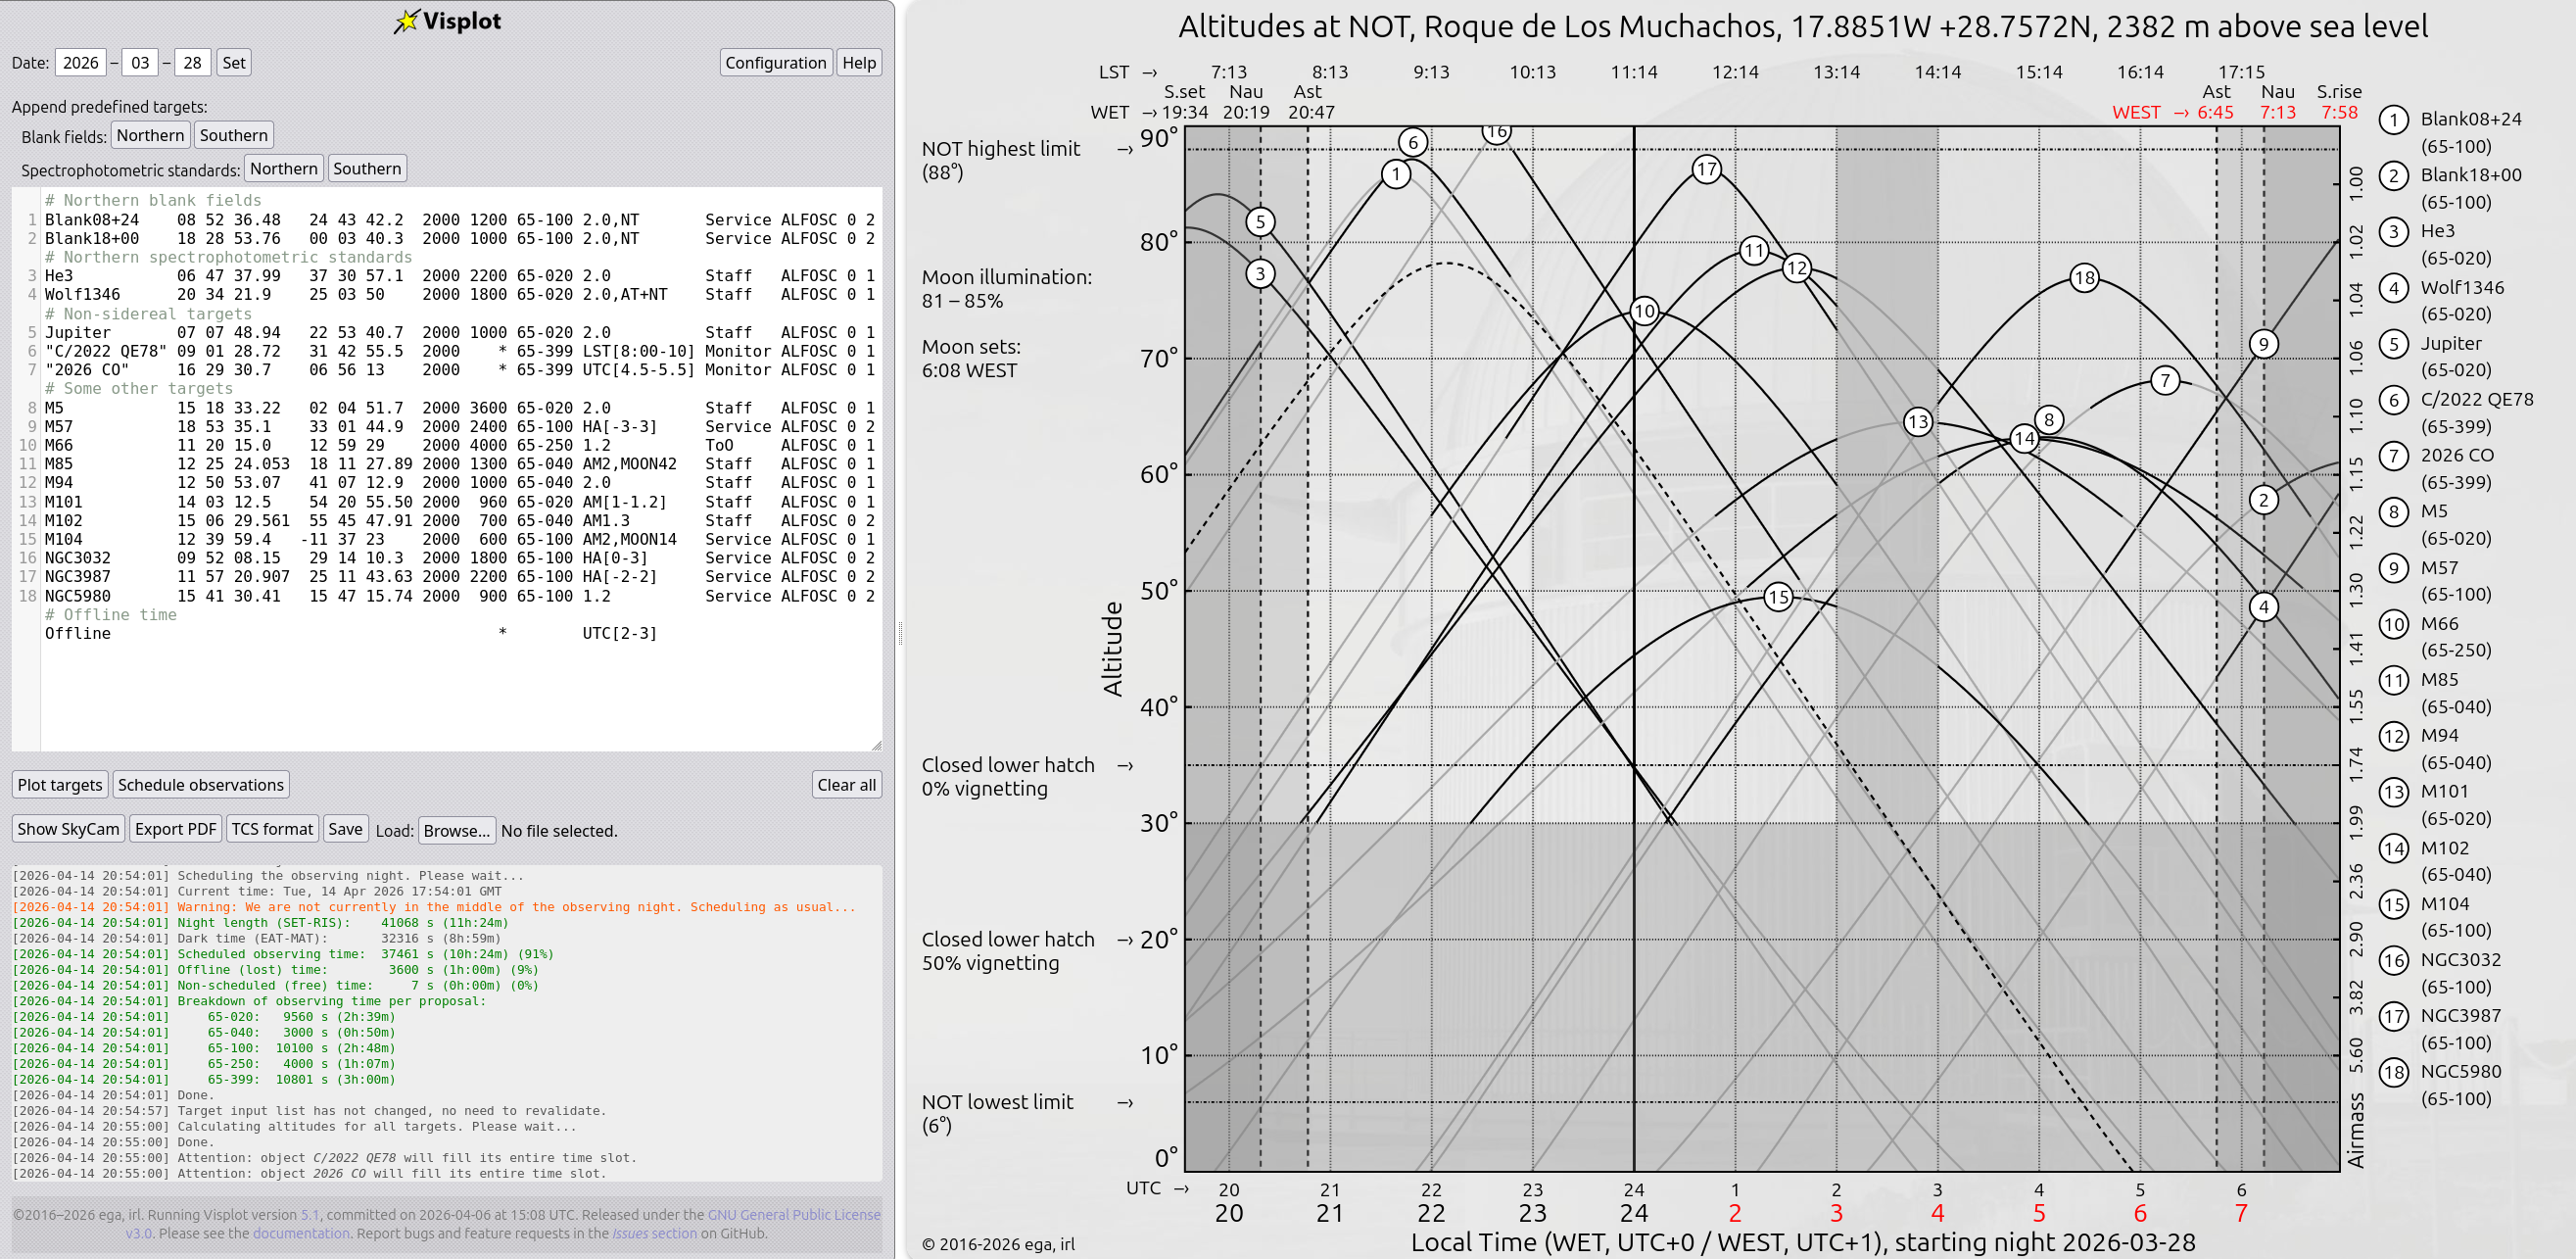
Fig. 4 Visplot visualization of the visibility curves for the inputed targets after pressing Plot targets.
Schedule observations
Click Schedule observations to let Visplot build an observing plan that respects your constraints and the selected scheduler options. After the first schedule is created, the button label changes to Update schedule. From then on, changes to the target list update the existing schedule rather than resetting it completely.
Visplot currently includes two different algorithms for scheduling: Greedy heuristic scheduling algorithm and Flexible-placement beam search.
Greedy heuristic scheduling algorithm
The greedy heuristic is Visplot’s original and default scheduling algorithm. It works by evaluating targets one time step at a time, calculating a weighted score for each schedulable target based on:
Priority: User-assigned target priority (highest values scheduled first).
Urgency: Time remaining until the target can no longer be observed (prioritizes targets nearing the end of their visibility window).
Altitude: The target’s current altitude (lower airmass = better data quality).
Slewing time: Angular separation from the previously observed target (minimizes overhead).
At each time step, Visplot selects the target with the highest weighted score and schedules it. The algorithm then moves forward in time and repeats. This approach is fast, predictable, and well-suited for interactive refinement. It produces operationally sensible schedules in most night-planning scenarios.
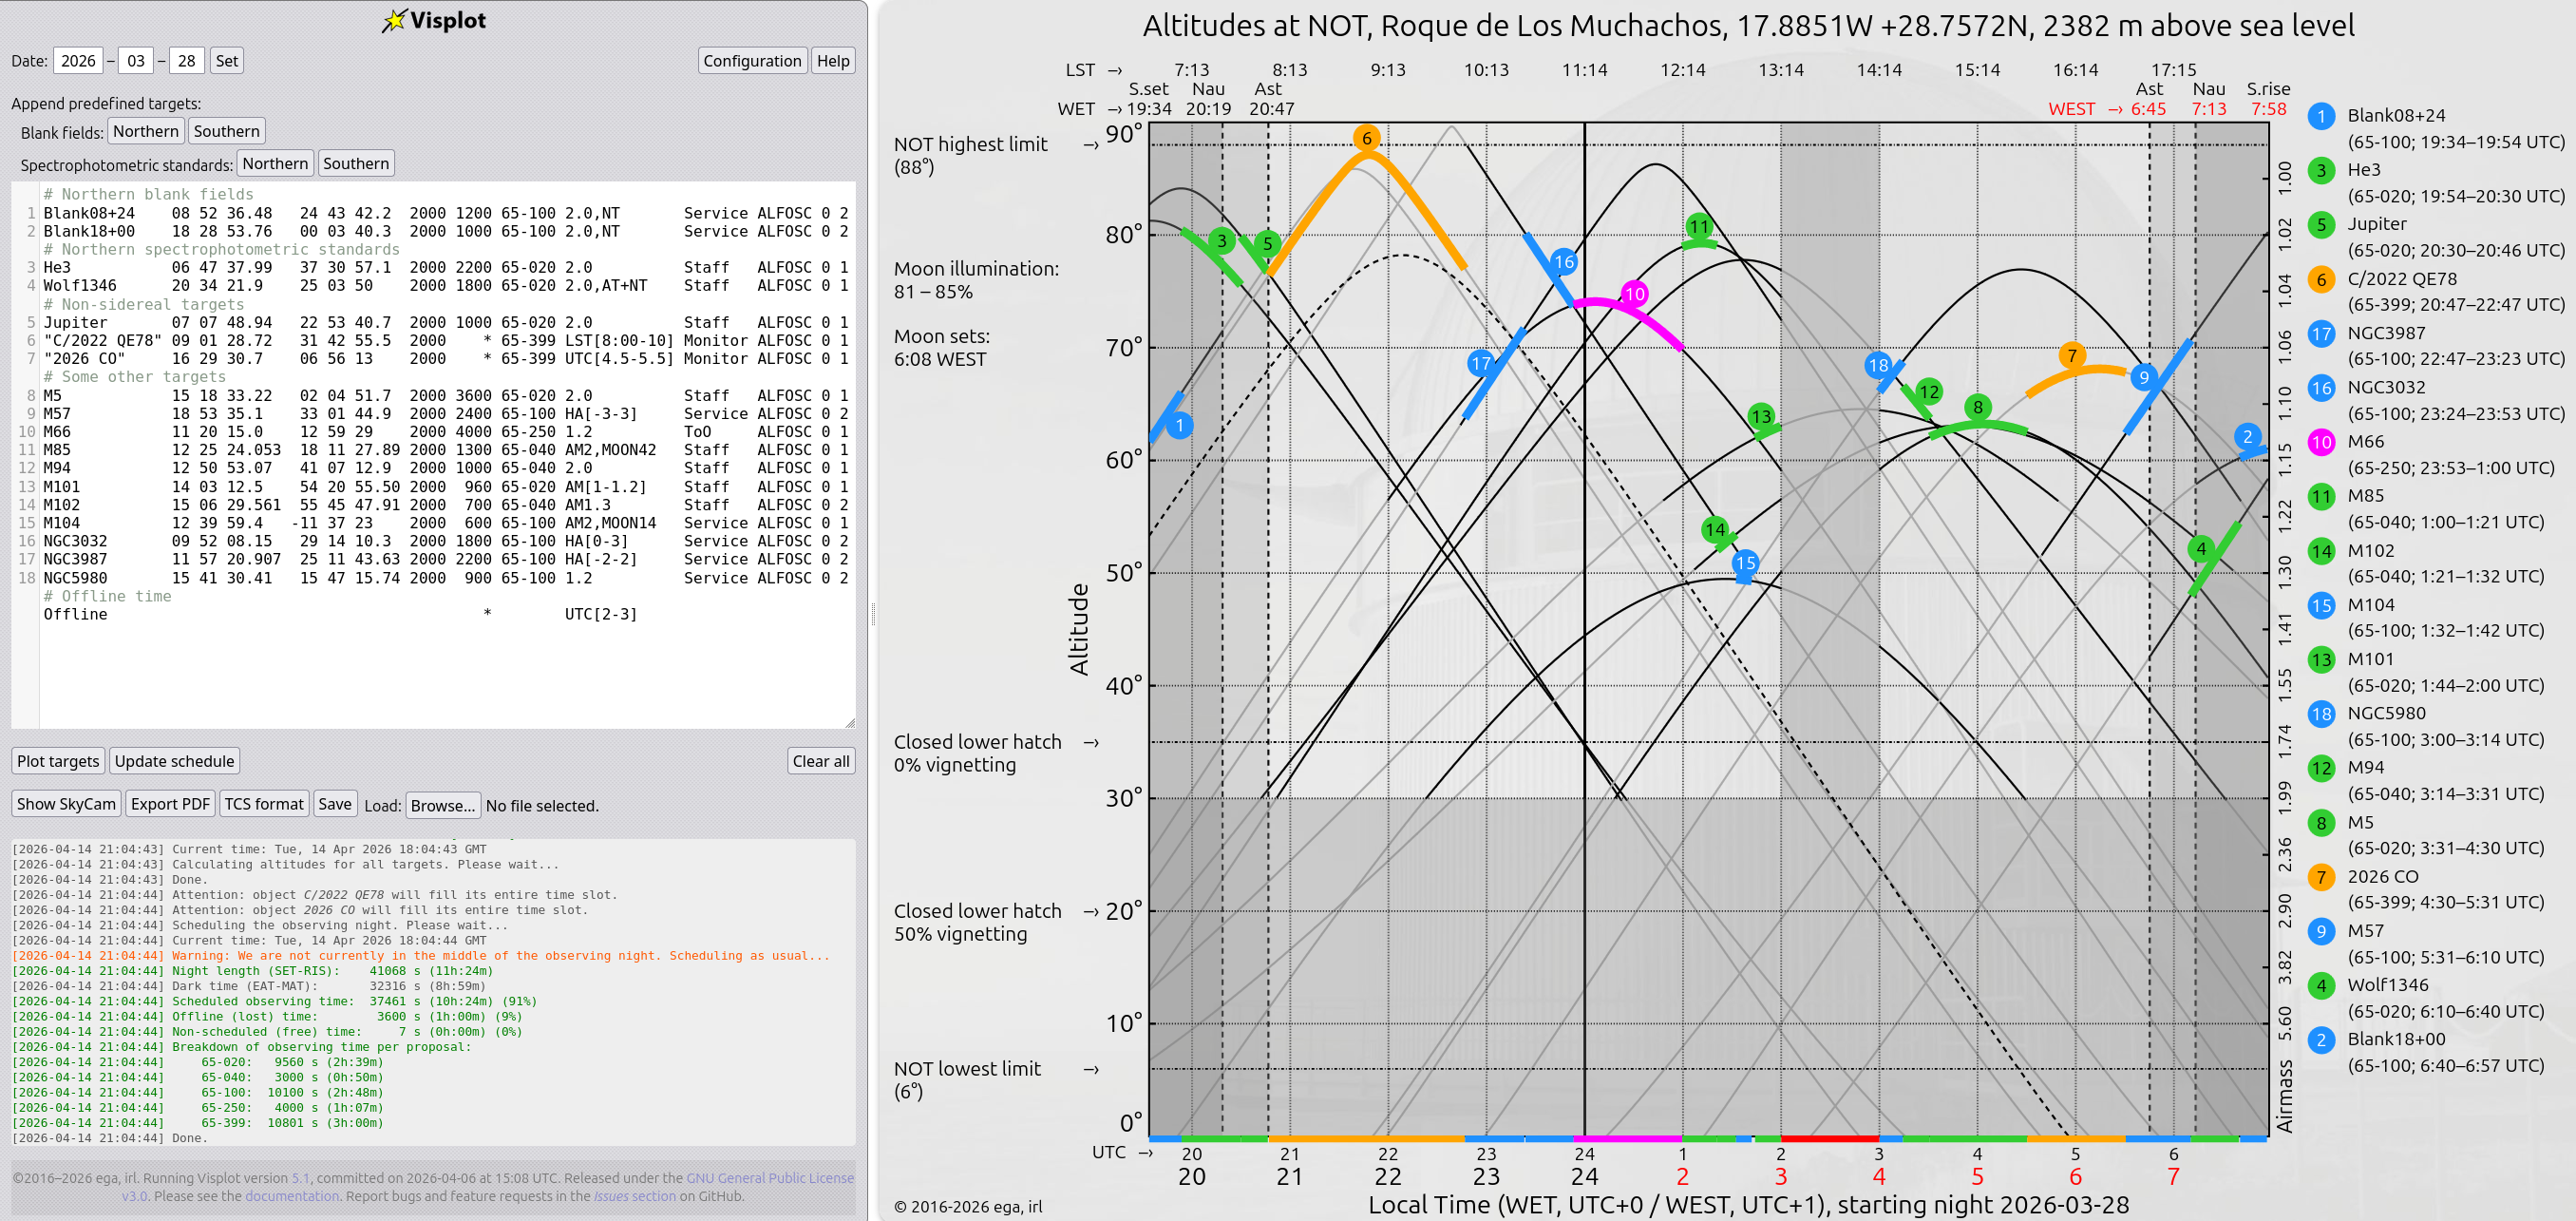
Fig. 5 Example output from the greedy heuristic algorithm.
Flexible-placement beam search
The flexible-placement beam search is a more sophisticated scheduling algorithm introduced for complex, tightly-constrained observing nights. Instead of making a single greedy choice at each time step, it maintains a set of parallel scheduling candidates (a “beam”) and explores multiple scheduling paths simultaneously. This allows it to:
Backtrack: Reconsider earlier scheduling decisions when they lead to dead-ends.
Find better solutions: Escape local optima that the greedy algorithm might settle for.
Handle tight constraints: Excels when targets have overlapping, narrow visibility windows or conflicting priorities.
The trade-off is computational cost: the beam search is slower, especially for nights with many targets. However, for challenging nights where the greedy algorithm fails to schedule all feasible targets, the beam search often finds better solutions. It also respects the same weighting criteria (priority, urgency, altitude, slewing) as the greedy heuristic, maintaining consistency in the scheduling philosophy.
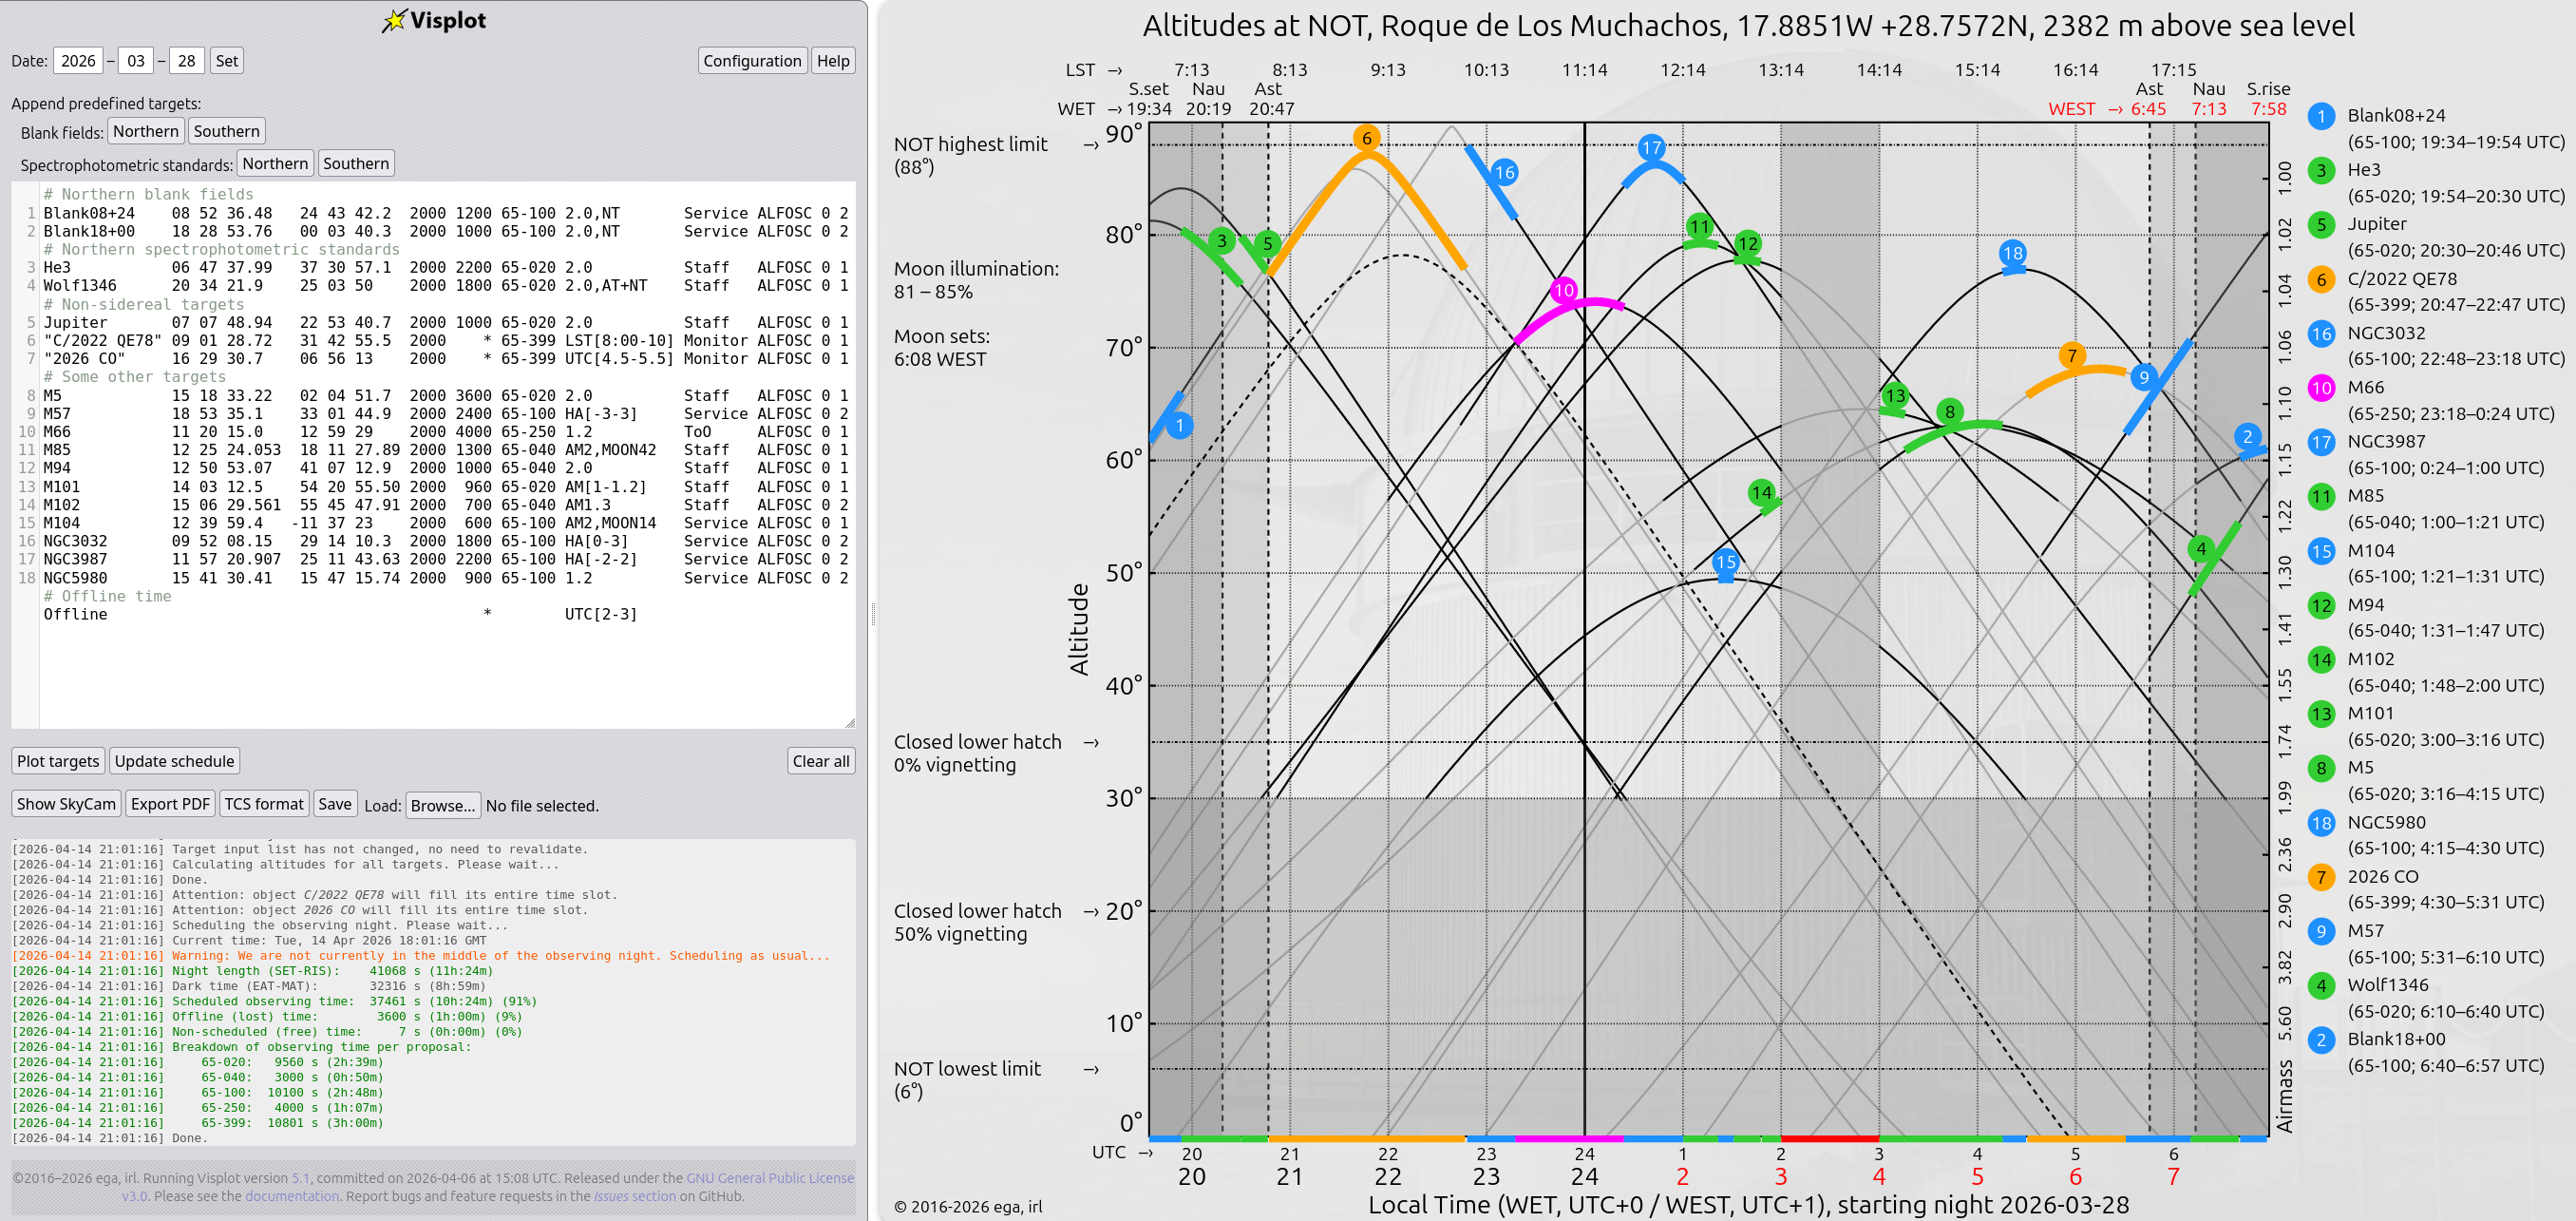
Fig. 6 Example output from the flexible-placement beam search algorithm.
When the schedulers disagree: a deeper comparison
This is a good test case for the two scheduling engines. We use a small set of long observations clustered in the first part of the night, plus a long Offline block that leaves the end of the night mostly empty.
Object1 10 00 0  25 00 0 2000 6000 project1 2.0       Staff ALFOSC 0 1
Object2 10 00 0  85 00 0 2000 6000 project2 3         ToO   ALFOSC 0 3
Object3 06 00 0  35 00 0 2000 6000 project1 2.0       Staff ALFOSC 0 1
Object4 18 00 0  45 00 0 2000 6000 project1 2.0       Staff ALFOSC 0 1
Offline                          *          UTC[24-3]
The first three objects compete for the same early-night window, while the last target is only safely observable after the offline period.
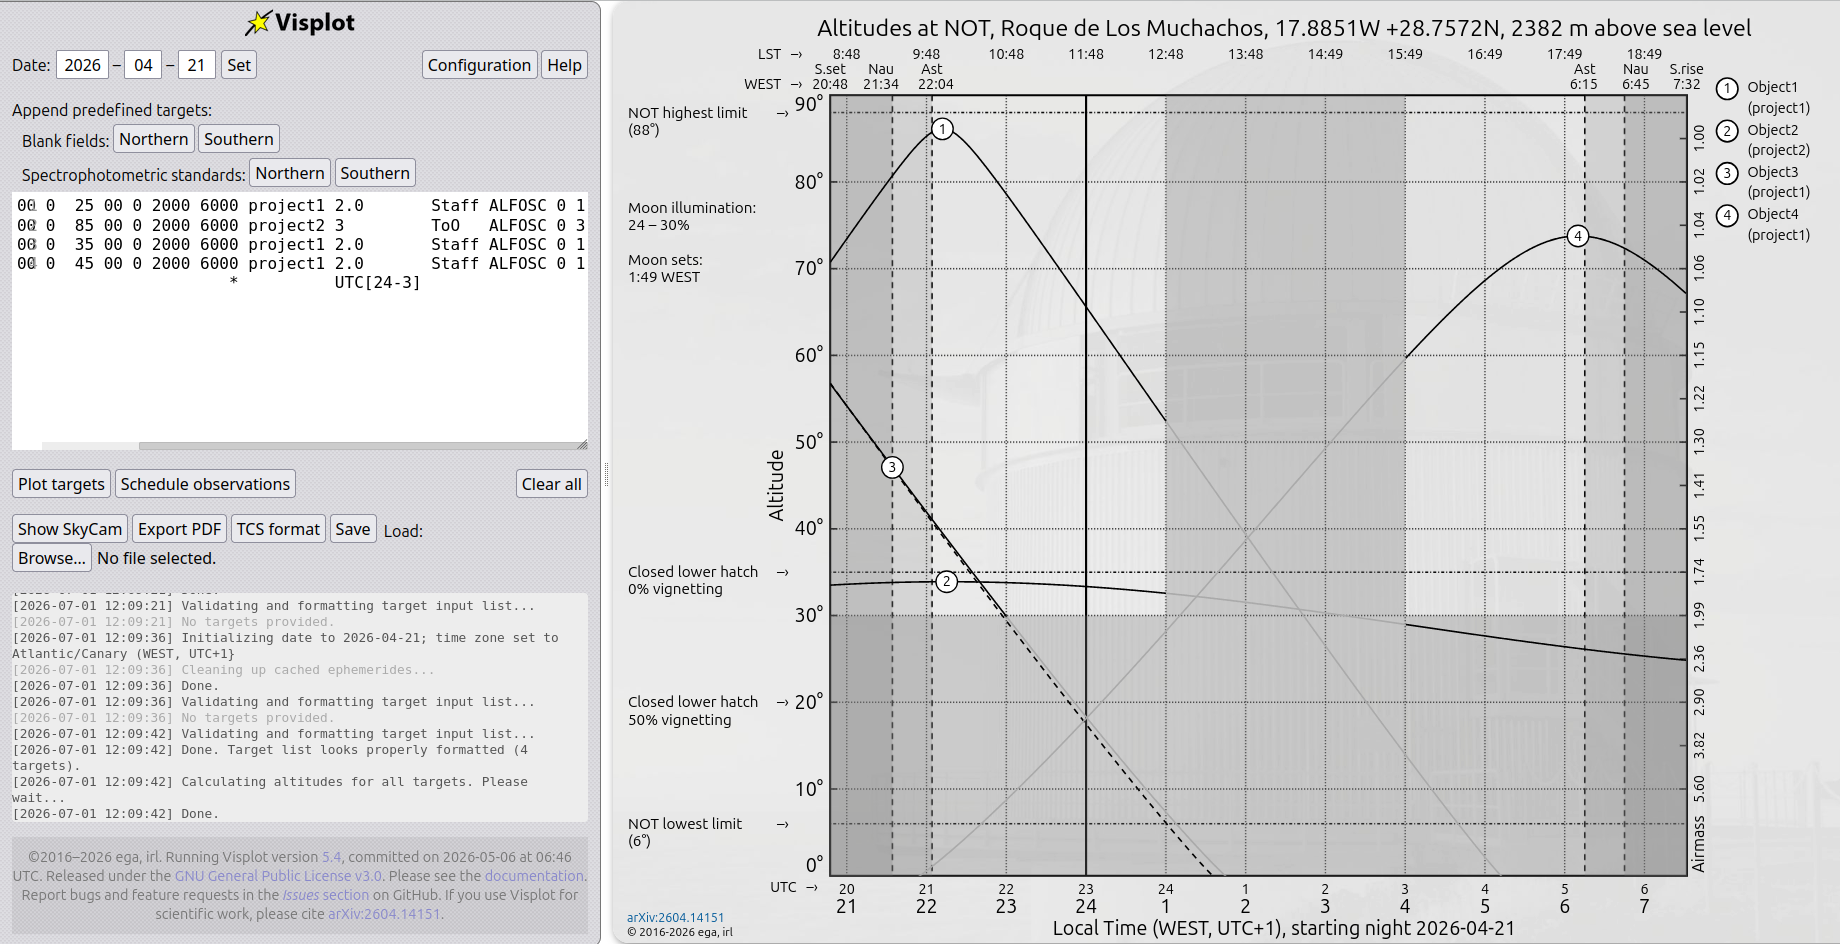
Fig. 7 Extreme target placement scenario.
When we run the Greedy heuristic scheduling algorithm scheduler, it selects the highest-scoring target at each step. In this case, that means the high-priority ToO is chosen early and target 4 is pushed out of the feasible window, leaving about 2:44 of empty time.
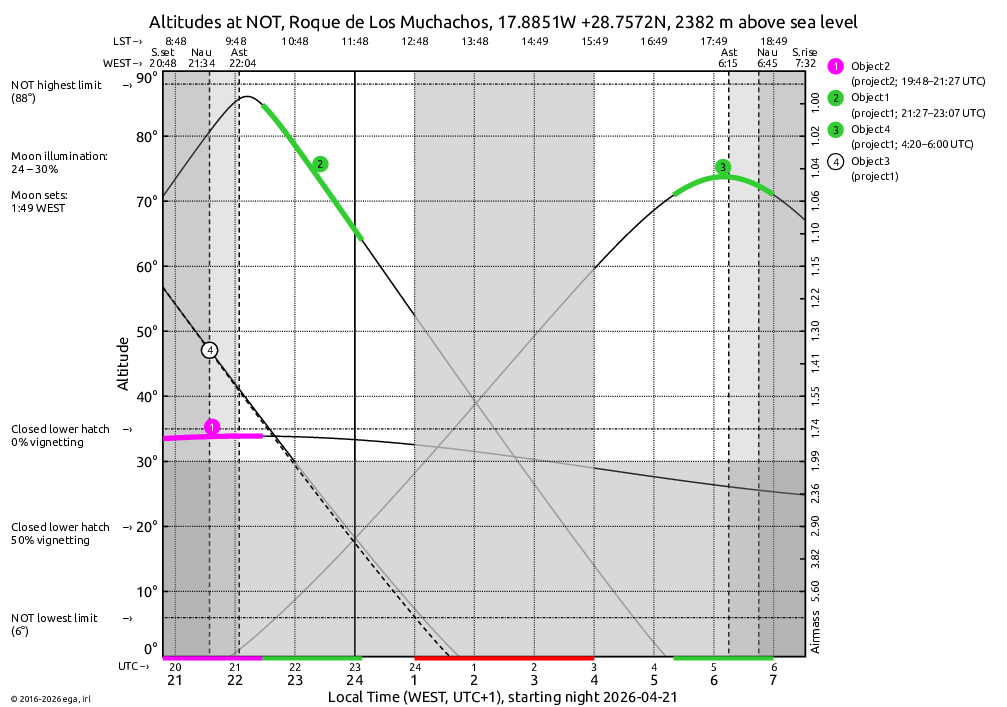
Fig. 8 Schedule produced by the Greedy heuristic algorithm.
By contrast, the Flexible-placement beam search scheduler evaluates whole-night placement and can recover from early choices that would otherwise dead-end. In this example it finds a valid plan for all targets while still respecting the same priority, urgency, altitude, and slewing criteria.
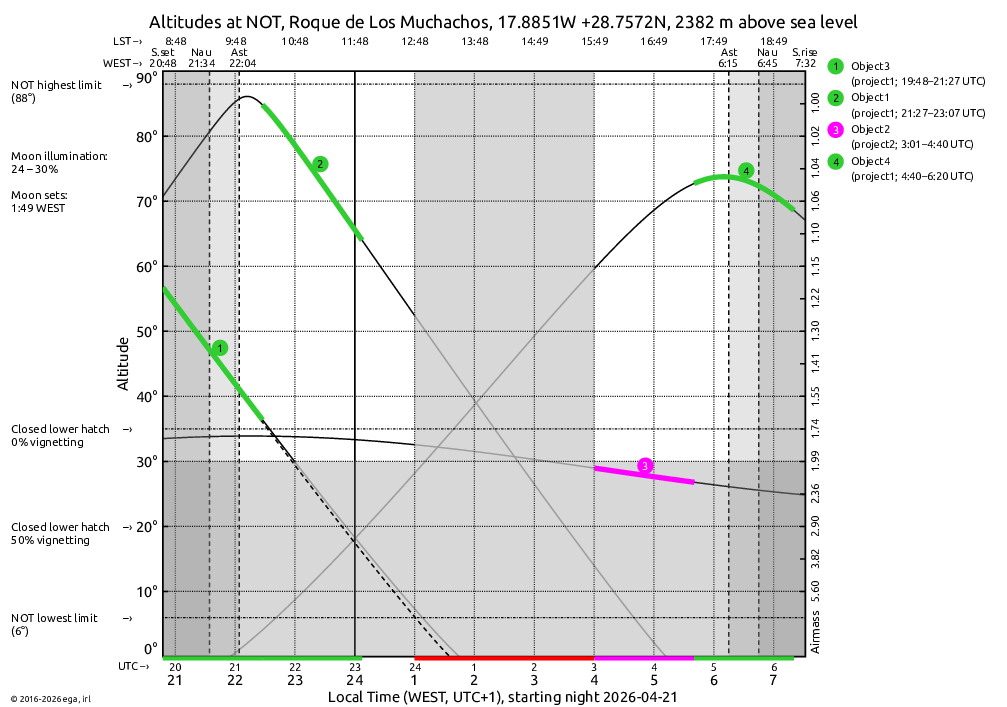
Fig. 9 Schedule produced by the Flexible-placement algorithm.
The takeaway is not that one scheduler is always better than the other. The greedy approach is fast and usually sensible, while the flexible beam search is better at extreme, tightly constrained cases. If the night is not promising, you might still choose to observe the ToO first and accept a less-complete schedule, and that is a perfectly reasonable operational choice.
Most nights will not expose a large difference between the two algorithms, but when constraints pinch hard, it helps to know why the schedulers can diverge. In practice, the choice is still up to the observer — sometimes that means choosing the one that feels best for the night, not just the one that is technically optimal.
Review and refine
Drag and drop targets on the right-hand side of the plot to manually reorder the sequence. Visplot will attempt to preserve feasibility after reordering.
Use the Clear all button to reset the target list and start fresh, returning to that blissful moment before you realized you entered the coordinates wrong.
(Pro tip: During a long night, manual reordering can be a lifesaver when unexpected clouds roll in or when you realize that target #7 is actually brighter than you thought. Or when you make a typo at 3 a.m. and need to recover gracefully.)
Target Details
Click a target number on the plot to open the details panel and the ALADIN finding chart.
Details include Proposal, Type, RA, Dec, Epoch, Moon distance, Obstime, and Instrument
Mark a target as observed; it will be redrawn in green and excluded from future scheduling moves.
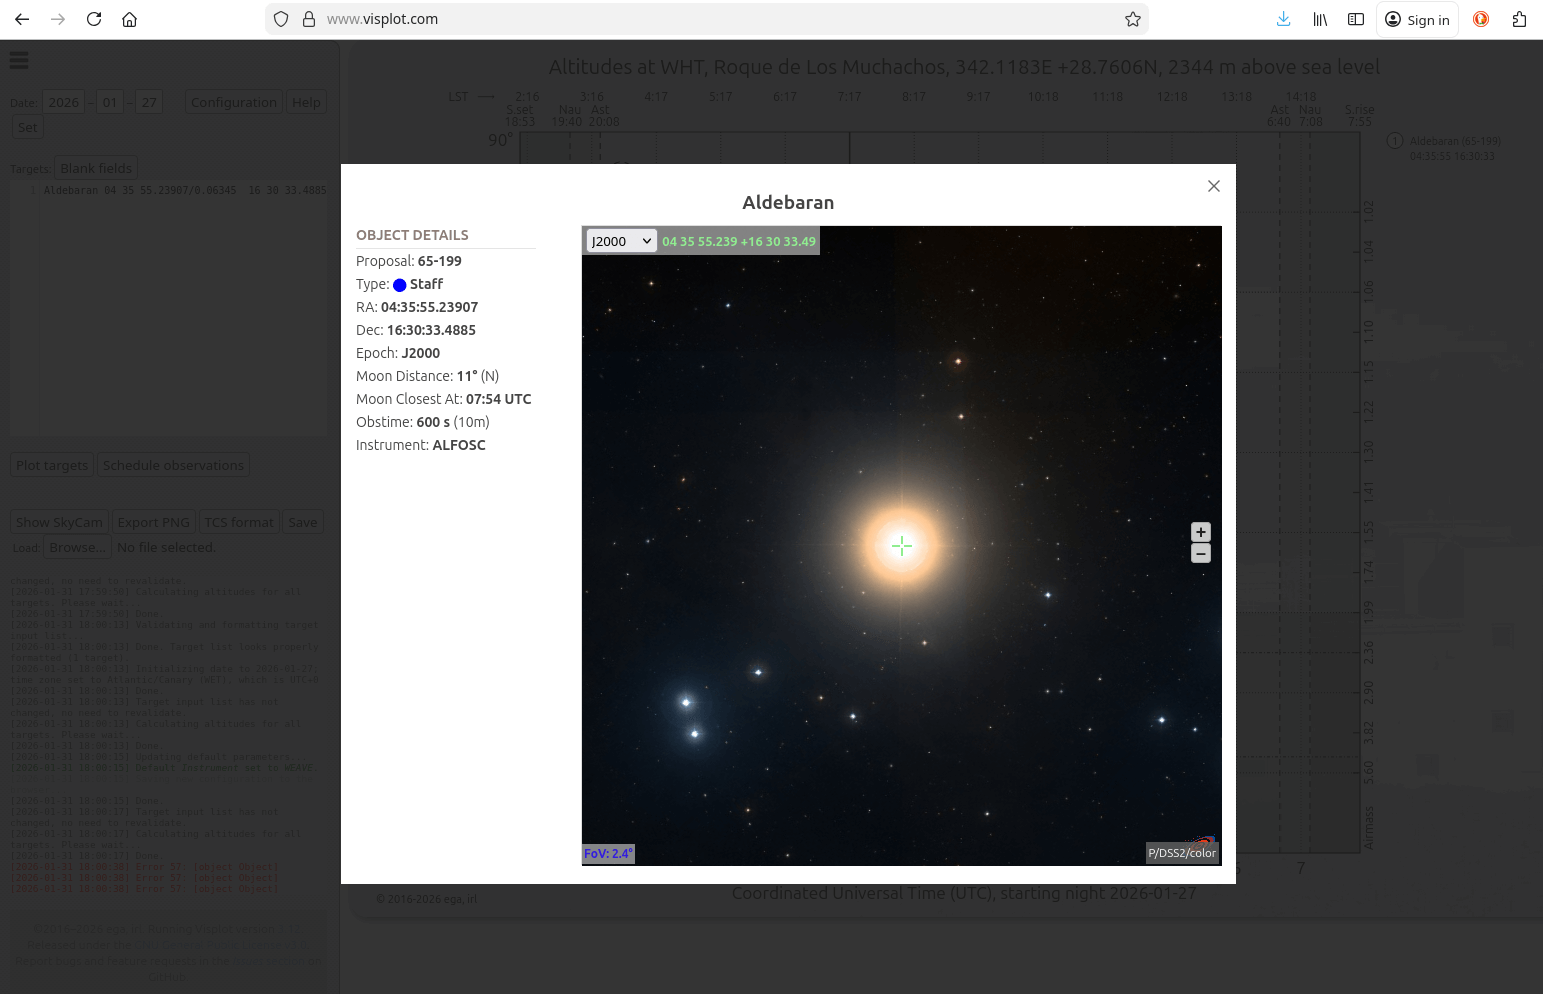
Fig. 10 Target details panel
Configuration panel
Press Configuration to open the settings panel. The configuration panel is divided into three main areas:
Telescope selection and map
Default values for new targets
Scheduler options and display settings
Telescope selection and map
The interactive world map displays pins for all pre-configured telescopes. You can:
Zoom and click: Click on a telescope pin to select it.
Search: Use the text box to search by telescope name or location (e.g., “NOT” or “La Palma”).
View all: Press the “View all” button to fit all telescopes in the current map view.
Zoom to telescope: Press “Zoom to telescope” to navigate to the selected telescope on the map.
This beats hunting through a dropdown menu with 100+ telescopes. (Especially when your brain is running on lukewarm coffee at 2 a.m.)
Telescope-specific pages
Some telescopes have dedicated Visplot pages with pre-configured settings and additional resources. These are accessible at URLs like https://www.visplot.com/[telescope_code] (e.g., https://www.visplot.com/not for the Nordic Optical Telescope). Check the Useful links page for a full list of available telescope-specific pages and their URLs.
Default values
Set the default epoch, observing time, proposal ID, maximum airmass, observation type, and instrument. You can also customize the display colors for each observation type.
Scheduler options
Scheduling behavior:
Do not schedule in the past during an observing night: Once the night has started, new schedules will only include observations starting after the current time. Useful for live observing refinement.Relabel targets according to the schedule order: Automatically renumber targets to match their scheduled sequence (target #1 is the first to be observed, etc.). Helps keep things organized.Allow observations over-the-axis(equatorial mounts only): Permits observations on either side of the meridian for equatorial telescope mounts. Expands your scheduling flexibility.
Scheduler algorithm:
Greedy heuristic: Fast, real-time friendly algorithm best for most observing nights. See Greedy heuristic scheduling algorithm.Flexible-placement beam search: More sophisticated algorithm for complex, tightly-constrained scheduling problems. See Flexible-placement beam search.Schedule observations between:
Sunset / SunriseNautical twilightsAstronomical twilights
Scheduling weights:
Priority
Urgency
Altitude
Slewing
Display settings
Enable or disable visual helpers such as the last possible start time marker.
SkyCam
The Show SkyCam button opens a live camera overlay when a configured sky camera is available for the selected telescope. The overlay shows current UTC and LST and updates automatically.
If a valid target list has been plotted, the targets are overlaid on the SkyCam view and their positions are refreshed automatically. This is especially useful when the sky is partially cloudy, humidity is climbing, or when rapid weather changes require re-planning. (Because nothing ruins a night like discovering the clouds have other plans for your targets—except maybe an unexpected equipment failure, but we won’t go there)
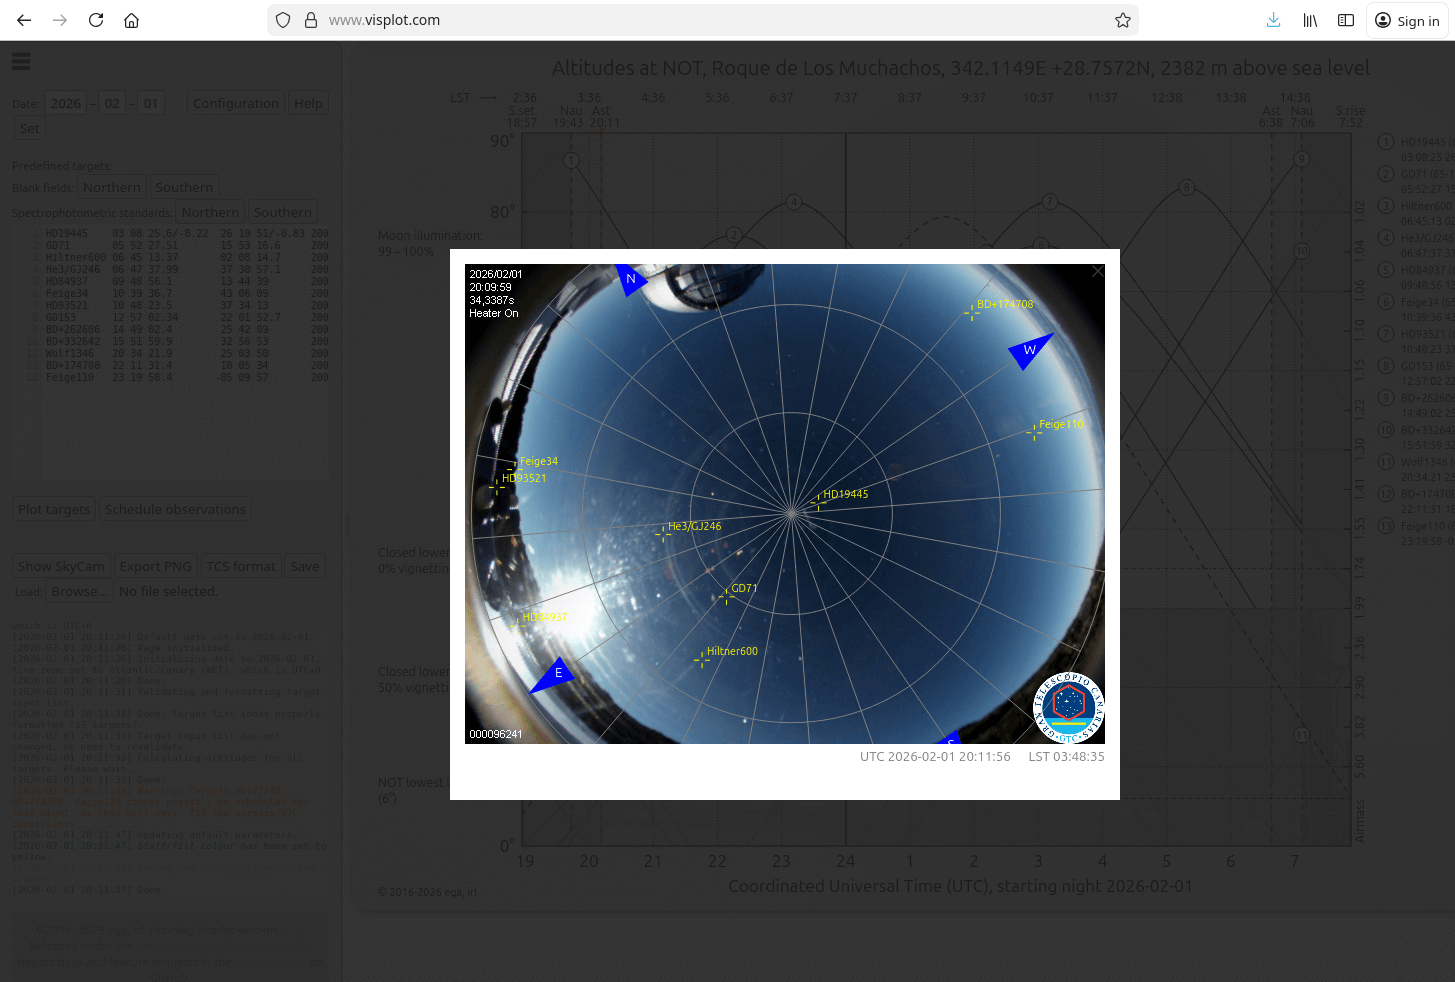
Fig. 11 Skycam view
Saving and loading
Save downloads a Visplot session file containing the current target list, schedule, and configuration.
Browse restores a saved session file and returns Visplot to the previous state.
Use this feature to prepare a plan in advance and continue working on it later, or to transfer a plan from one computer to another.
Export options
Export PDF: save the current plot as a PDF file.
TCS format: convert targets to a TCS source catalogue.
Troubleshooting
Use a modern browser with HTML5 support.
Make sure the observing date is set before plotting targets.
Check that coordinates, dates, and constraints use the correct syntax.
If targets do not appear, verify that the list has been plotted and that there are no syntax errors.
Logger
The sidebar log (located at the bottom of the left panel) is your window into what Visplot is doing internally. It’s like having a helpful colleague whispering in your ear, pointing out what works, what doesn’t, and why.
What the logger reports
The logger displays messages in real-time as you interact with Visplot:
Info messages (grey): Confirmation of successful actions (e.g., “Loaded target list with 15 objects”).
Scheduling messages (green): Highlights of important results (e.g., schedule statistics, target counts per proposal).
Warnings (orange/yellow): Non-fatal issues that might affect your planning (e.g., “Target is not observable tonight”).
Errors (red): Problem that prevent an action from completing (e.g., “Target identifier unknown to SIMBAD”).
Each message includes a timestamp, making it easy to trace the sequence of events.
Debugging your target list
When Visplot encounters an invalid target line, the error message includes:
Error description: What went wrong (e.g., “Error: Unresolved targets:”).
Line number: Exactly which line has the problem (e.g., “Line #7”).
Suggested fix: How to correct it (e.g., “for each object you must provide at least the Name, RA and Dec”).
For example:
[2026-04-14 22:03:39] Warning: Target au is not in SIMBAD; trying JPL Horizons.
[2026-04-14 22:03:39] Retrieving targets from JPL Horizons: au. This may take a while...
[2026-04-14 22:03:40] Results received from Horizons
[2026-04-14 22:03:40] Warning: Horizons error for au: Ephemeris block not found
[2026-04-14 22:03:40] Error: Unresolved targets: au
[2026-04-14 22:03:40] Error: (Line #2) For each object you must provide at least the Name, RA and Dec
[2026-04-14 22:03:40] Error: Post-processing failure -- TargetList.prototype.validateAndFormatTargets@https://www.visplot.com/js/visplot_targets.js?v=5.1:1641:15
In this case, “au” on line 2 is not recognized by SIMBAD. You can either:
Provide the coordinates manually (e.g.,
au 23 34 34 -01 19 36).Check the spelling and capitalization.
Use a different identifier (e.g., “EQ Piscium” or “HR 8832”).
Tips for efficient debugging
Read from the bottom up: The most recent message is at the bottom of the log, so scroll there first.
One error at a time: Fix the first error, then re-plot. Often, one mistake cascades into multiple errors.
Copy coordinates from SIMBAD: Use the database directly to verify object names and positions before entering them.
Test incrementally: When adding many targets, add a few at a time and plot to catch errors early. (Debugging 50 typos at 3 a.m. is nobody’s idea of fun.)
The logger as a debugging tool
If you’re stuck, the logger is often the answer. Before asking for help:
Look at the log for error messages.
Identify which line(s) are problematic.
Cross-check your input syntax against the examples in Target input syntax.
(Pro tip: Many “bugs” are actually just creative interpretations of the input syntax. The logger is very good at calling this out diplomatically.)
Community and support
You’re not alone in the night—or in your Visplot questions. Here are the resources available to help you:
Quick help, right now
Help button: Need a quick reminder about input syntax, scheduler options, or what a button does? Press the Help button in the interface for concise guidance without leaving Visplot. Perfect for those moments at the telescope when you need an answer in 10 seconds, not 10 minutes.
Comprehensive documentation
Read the Docs: The full Visplot documentation site, including tutorials (like this one), detailed reference material, installation instructions, and troubleshooting guides. Start here if you’re planning a session at home or want to understand Visplot in depth.
Visplot Exciting News: Stay updated with the latest features, bug fixes, and announcements from the Visplot development team.
Report problems or suggest improvements
GitHub Issues: Found a bug or have a feature request? Check the issues page to see if someone has already reported it, or open a new issue. For detailed guidance on what to include when reporting a bug or requesting a feature, see Reporting Issues or Requesting Features.
Connect with other observers
Visplot Google Group: Join a community of astronomers, telescope operators, and developers using Visplot. Ask questions, share observing experiences, exchange tips and tricks, and learn from others’ solutions.
To join or post: visplot (at) googlegroups.com
Contributing code or translations
GitHub Repository: Visplot is open-source. If you’d like to fix a bug, add a feature, improve documentation, or contribute a translation, you’re welcome to submit a pull request. The code is well-organized and documented; developers of all levels have contributed improvements.
Wrapping up
Congratulations! You’ve now got the full tour of Visplot—from plotting your first targets to scheduling a night that even the stars would envy. Remember, the key to great observing is preparation, and Visplot is here to make that as painless as possible. If you run into snags, the logger is your best friend, and the community is always ready to lend a hand (or a fresh pot of coffee).
For more advanced tips, check out the other sections of this documentation, or dive into the code if you’re feeling adventurous. Clear skies and good observing!